Remember the olden days of digital marketing when it was enough just to have email segments? This was the same golden era when having a mobile site was considered advanced and SEO was a magical black box.
Today, personalization and segmentation is expected by your superiors, your peers, and even your customers. They know when they’re added to the “spray and pray” marketing list and will unsubscribe before you have a chance to get to know them.
This is a huge challenge for marketers: how do you segment visitors if they don’t have history with the site? The answer lies within the audience buckets you create. When you understand your site the general population of your visitors, you’re able to predict their buying behavior and eventually market to new audiences with desired results.
Let’s rewind and start with the basics: how should you segment your audiences?
The Benefits of Segmenting Beyond Demographic Data
When a marketing team starts segmenting its customers, it tends to focus on basic demographics like age, gender and geo. These are the basic segments covered in Google Analytics tutorials and are featured on the front page of its interface. Plus, at face value, this segmentation makes sense: if you sell lingerie for women, don’t you want to market primarily to women?
Well, if your audience is the entire female population, then your “segment” is 3.8 billion.
If your audience is American and Canadian women, then your segment is 175 million.
Even if you drill down to the 18-35 year-old range, you’re still marketing to several million people, which doesn’t sound like much of segment after all.
The key to smart segmentation is looking beyond the basic data and segmenting by deeper criteria: intent to buy, interest, income, and personality.
Let’s continue with the lingerie example. This store (maybe Shmictoria’s Secret?) is found nationwide and has a strong ecommerce presence. Their segmentation would look like this:
- College Girls — they spend $50-$100 per trip and might use their parents money. They like cutesy lingerie for new dates and purchase 6-12 times per year.
- Recent Grads — after graduation, student loans and unemployment lead to a decrease in visits. The average ticket is $20-$50 and purchases drop to 2-4 times per year. This bucket responds well to coupons.
- Established Twenty-Somethings — building out a career means they have more disposable income and spend $100-$200 per visit. They’re on the dating scene looking for something long-term and shop 4-10 times per year.
- Married Women — these ladies like to look nice for their husbands on occasions like Valentine’s Day and spend $70-$100 when they shop. They visit 5-6 times per year.
Now, this example is by no means an actual breakout of lingerie shoppers, but it uses context to provide buying behavior. After learning about these audience buckets, any new marketing vendor will know that “recent grads” will come out for sales or discounts while “married women” should mostly be targeted to around holidays. Each audience bucket provides deep insight into the customer and how to market to them.
So how do you create your audience buckets in a way that provides this level of detail?
I’m glad you asked.
Identifying Complex Segments in Google Analytics
While every business and industry will have different buyer personas, most will be able to utilize the criteria we suggest to bucket your customers. If there’s anything we miss, or if you’ve found a segment to be particularly successful, let us know in the comments!
Frequency
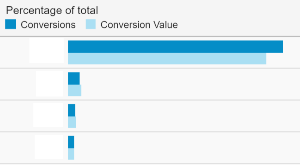
This section of the behavior tab will answer the question: how often do visitors frequent my website? This is important both for ecommerce sites looking for a quick transaction, and blogs or software providers trying to determine how engaged their visitors are.
In the screenshot below, you can see the strongest frequency for this company is 2, meaning a customer might visit and browse the site, and then come back again when they decide to purchase.
Unfortunately, Google Analytics results tend to ask more questions than they answer. Further analysis might include:
- Do customers start the purchase path on mobile (1) and convert on desktop (2)?
- Do customers add something to their carts on the first visit?
- What are the barriers that prevent customers from buying on the spot?
However, by understanding the time it takes for a customer to make a purchase, or the frequency with which they engage with your content, you’re able to identify low-hanging fruit that converts easily versus the big fish that are worth the wait.
Time Lag
Time Lag determines how long it takes a customer to actually return and make a purchase. The data is significantly more specific than frequency and recency and can be monitored around specific times to bucket your customers.
Case Study — Tuft & Needle
In the past few years, online mattress and eyewear companies have been trying to disrupt an industry that’s known for overcharging and intimidating customers. However, mattresses and glasses are hardly easy purchases. Saving up to buy might take months, and several visits before they’re sure about buying.
Tuft and Needle bragged that despite avoiding the Cyber Monday chaos, they still saw record sales that day. Using the Time Lag data, they would be able to create two audience buckets for their customers:
- Customers who visited that day and made a purchase
- Customers who had been visiting the site in the previous days but waited to pull the trigger on Cyber Monday.
While New vs. Returning customers would also show who visited to buy that day, the Time Lag data identifies what customers had been shopping two weeks or three weeks before and didn’t convert. Even if Tuft & Needle didn’t have a Cyber Monday strategy, they could still prepare for a higher bounce rate and lower conversion during the month of November.
“Other Categories” Under Interests
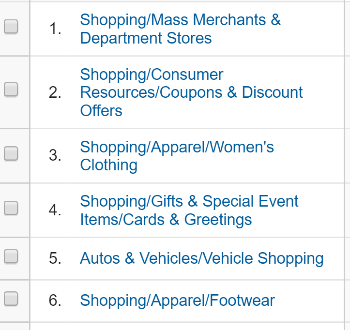
The affinity categories tend to be a vanity metric when building audience buckets. For example, if you’re a travel blog, I should hope the majority of your site visitors are interested in travel. However, hidden below the in-market segments is the ambiguously named “other categories” section which actually has a few gems. The key to finding them is playing with your filter tools.
As you can see, by filtering out any results that don’t include the word shopping, a local retailer can better understand the customers that are visiting the site:
There are definitely outliers, like the Autos & Vehicles result, but the business would be able to identify three core segments from this data:
- Regular department store shoppers
- Discount shoppers and deal seekers
- Shoppers looking for a gift of gift card (not their core target market)
This department store would likely see an uptick in the third segment around the holidays as boyfriends and husbands pick up gifts or gift cards for their loved ones. This context about buyer behavior is immediately more valuable than looking at male vs. female shoppers during the holidays.
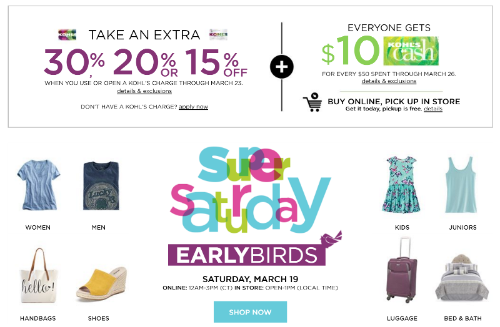
By understanding who is buying, the company can now tailor the message to the appropriate audience buckets. This is why you will always see the discount first on Kohls’ website, followed quickly by women’s fashion and shoes.
Search Queries
The acquisition tab is a goldmine for customer data and behavior. You’re able to see what landing pages visitors hate, what search terms they’re responding to, and what campaigns are hitting the right note. Personally, my favorite tab is the search queries option under SEO.
By filtering out the obvious keywords like you’re brand name, you’re able to see what people are searching for that you haven’t been highlighting.
Maybe this year has been unseasonably warm and customers are starting to look for swimwear before you’ve started marketing it.
Maybe another Hunger Games movie came out and search queries for archery supplies spike at the local outdoor activities store. (Seriously, this is a trend!)
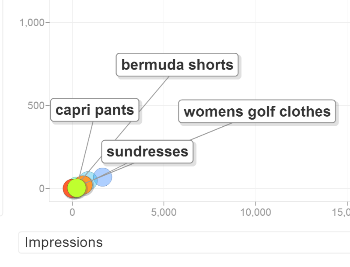
The best way to identify audience segments is to change the line chart at the top to a motion chart. Over time, you should notice spikes in outlying keywords (which might have potential) but should also paint a picture of your core groups of customers.
Even if there’s still three feet of snow on the ground, the customers above are clearly ready for spring break, which means it’s time to change your website from this:
Before and After
Now that you’re able to use Google Analytics, you’re better able to group your customers into audience buckets and create a marketing strategy around them. This is what the before and after looked like for our retailer example, isn’t it an improvement?
Old: We know our audience is women 18-35, some are in the north where it’s snowing and some are in the south where it’s spring. We should advertise spring apparel with winter clearance.
New: Our “Deal Seekers” have been waiting for a deal on winter apparel, so let’s send them an email coupon to bring them back once more this month. Meanwhile, our new customer acquisition plan can be focused on “College Shoppers” who are already looking for cute spring break outfits.
Capturing On-Site Customer Behavior to Form Audience Buckets
While you might eat, breathe, and sleep Google Analytics data, not everyone prefers this tool. Even if you’re familiar with these sections, your co-workers might balk at the data or mentally turn off once you start talking in math-ese.
This is where on-site analysis tools come in. These three tools can help you identify audience intent and sort visitors into audience buckets.
Heat Maps and Replay Tools
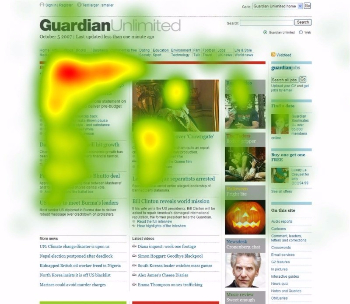
Session replay software has to be one of the most wonderfully creepy tools in the marketer’s arsenal. By recording an anonymous session, site admins can see exactly how visitors use the site, and where the design team is going wrong.
These tools can also be used to bucket your customers by intent. They’re a quick visual way to identify exactly where a customer wants to go.
As a real world example, a restaurant would use heat maps to identify three different audience buckets:
- New customers looking for a phone number and address
- Customers with specific dietary needs looking to see if there’s something they can eat
- Business admins looking to schedule catered lunches
Once the restaurant understands that those are the three main reasons people visit its site, it can design better content to attract those customers. It can create a catering menu or write a blog post about vegetarian options.
No one ever said bucketing customers had to be complex. Sometimes it’s as easy as counting the clicks on your site.
On-Site Surveys and Pop-Up Questions
Yes, the word pop-up is considered a swear word in some marketing circles, but bear with me! There’s a way to do it without being invasive.
Introducing survey software is a quick and dirty way to learn about your customers and better sort them into buckets. FluidSurveys offered a few best-practices when implementing these pop-ups, which will help your team better collect data — and avoid isolating site visitors.
- Limit the Number of Fields: only provide a few fields that customers need to fill in. Trust us, if they want to tell you more, they will.
- Set a Time Delay: hitting site visitors with questions about their experience when the page has barely loaded will only isolate them and increase your bounce rate.
- Keep Your Questions Short and Responses Easy: now is not the time for long-winded, open-ended questions.
- Let them Know When It Ends: If your survey tool follows an “if-then” method with follow-ups, let the visitor know they’re on page X of Y so they can see a light at the end of the survey tunnel.
Like identifying analytics, these survey responses are only as good as the questions you ask. If your questions are poor, then your results will be worse. Remember to A/B test your survey queries and change them up every few months to gain better insights.
Focuses By Spokal
This might be self-promotion, but we’re pretty freakin’ excited about our tool!
Focuses lets site admins tag different content pages with categories that are relevant to their products or services. When a site visitor lands on your content and submits their email, Focuses also records the tags that are associated with that address.
For example, a website that sells homeschool supplies tags their pages based on grade: K-5, 6-8, and 9-12. If a site visitor is looking at 5th grade history lessons and submits their email, Focuses will record the K-5 tag as well. Now the site admin is able to market directly to that customer’s needs without asking invasive questions.
Once the visitor is added to your contacts, Focuses is able to collect data on the search behavior. The mom in the past example might spend most of her time browsing K-5 materials because she has two kids at the elementary school level, but might also spend some of her time in the 9-12 range to find materials for her teenage son.
Your customers are rarely one-sided, so Focuses helps you better get to know them without asking them to fill out endless forms.
Using Your Audience Buckets to Segment Your Communication
Collecting pages of data on site visitors tends to leave marketers with a “now what” feeling. Amassing tons of data is easy, but executing on it is harder.
We recommend taking two different views when creating a marketing plan around your target market. First ask what your customers wants now, and then ask what they want after they buy.
First — Plan for the Next Purchase
This plan can range anywhere from two weeks to six months depending on your product, and is the easier of the two calls to action. Now that you know their buying style and interest, you can create a target campaign around the buyer’s persona and follow them until they buy.
This is where most blogs tend to end. The customer buys, the company gets a sale, and everyone lives happily ever after.
But what comes after?
Second — Plan for Post-Purchase Marketing
If there’s anything more annoying than an immediate pop-up, it’s retargeting ads that follow customers around long after they’ve actually purchased the product. The key is to understand when a customer buys and change the strategy around them accordingly.
Focuses also has “If-then” maps for websites trying to keep customers around for the long run.
For example, the mom looking for K-12 homeschool materials won’t need those forever. Eventually her kids will enter the 6-8 grades. Using “if-then” patterns, if she buys 5th grade education materials, then her next email should talk about preparing for middle school.
Another example is the retailer we discussed earlier. If a “deal seeker” uses a coupon to get a deal on winter clothes, then you want to start advertising spring wear to them. They might not buy until fall when it’s on sale, but you’re restarting them on their path to purchase.
Segmentation Works to Create Fewer Nos
Customers have a million reasons to bounce from your blog or website, and marketers are in a constant game of whack-a-mole trying to eliminate as many of those reasons as possible.
This is not relevant to me.
This is not what I wanted.
I already bought that last month.
Creating proper audience buckets works to take away a few of the nos and even generate a few more yeses. Remember, the more a customer hears an irrelevant message, the more likely they are to unsubscribe from you completely. Segmentation is just as much about survival as it is long-term growth.
